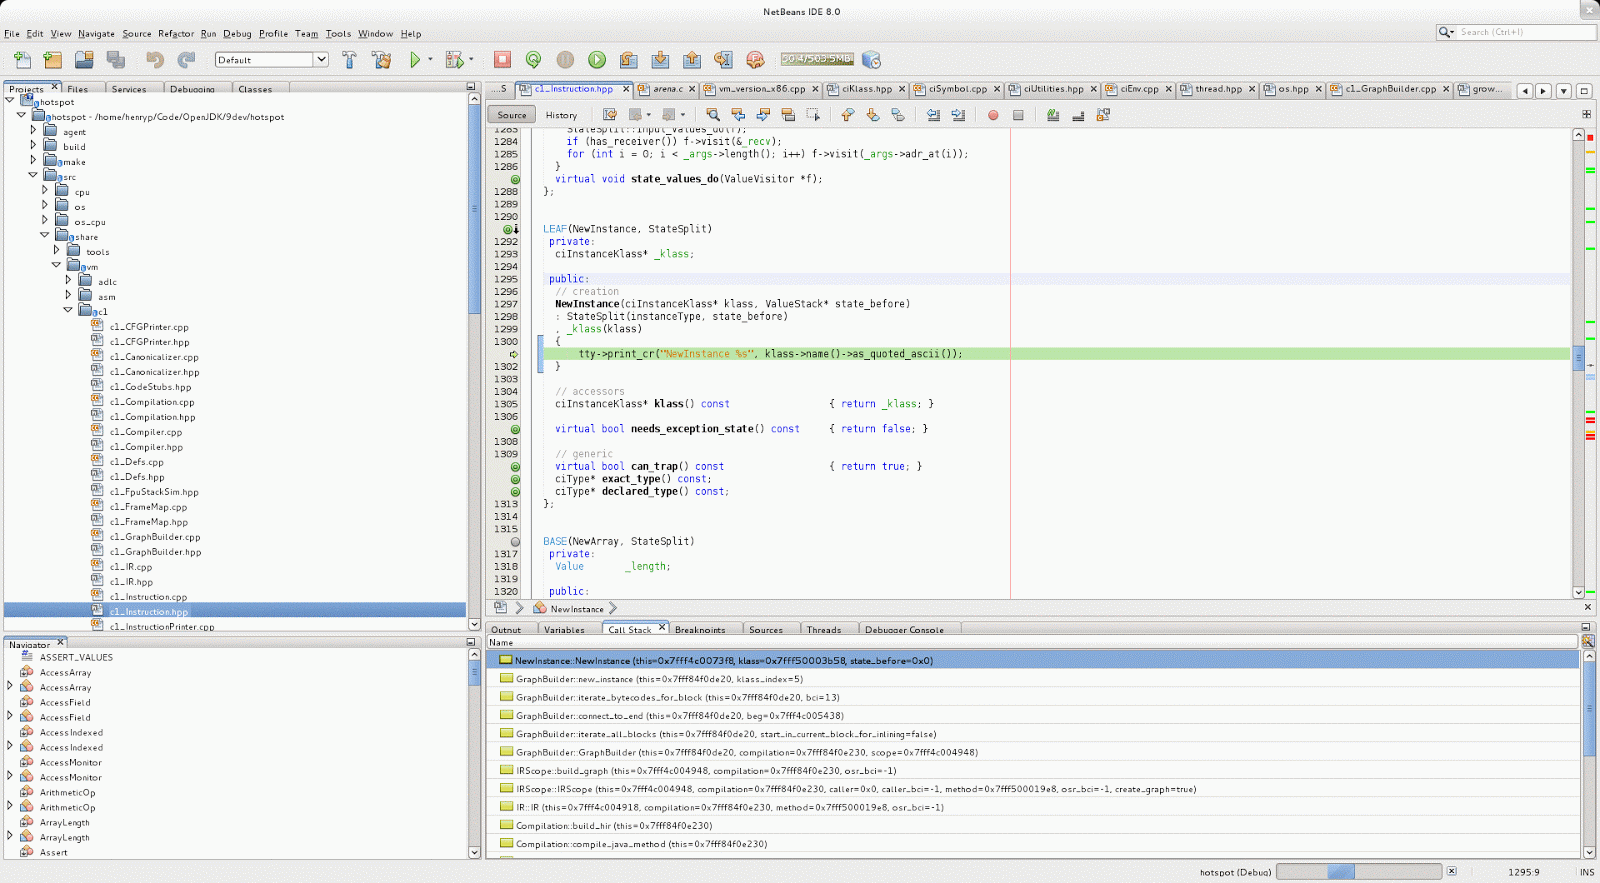
This is very nice. I've built my own JDK on Linux and am stepping through the C++ code as if it were a normal Java debug.
To do this:
1. Get the source code with:
hg clone http://hg.openjdk.java.net/jdk9/dev 9dev
2. Build with something like:
$ bash ./configure --with-debug-level=slowdebug --enable-debug-symbols ZIP_DEBUGINFO_FILES=0
$ make all CONF=linux-x86_64-normal-server-slowdebug ZIP_DEBUGINFO_FILES=0
$ make all CONF=linux-x86_64-normal-server-slowdebug ZIP_DEBUGINFO_FILES=0
or whichever CONF is appropriate to your system. This last step can take quite a long time (about 10 minutes).
The ZIP_DEBUGINFO_FILES is important (see here and here). This compiles the symbols into the artifact that allow debugging.
[Note: sometimes, I saw errors like:
gmake[2]: *** [/home/henryp/Code/OpenJDK/9dev/build/linux-x86_64-normal-server-slowdebug/jdk/demo/jpda/examples.jar] Error 1
gmake[2]: *** Waiting for unfinished jobs....
Note: Some input files use or override a deprecated API.
Note: Recompile with -Xlint:deprecation for details.
Note: Some input files use unchecked or unsafe operations.
Note: Recompile with -Xlint:unchecked for details.
gmake[1]: *** [demos] Error 2
make: *** [demos-only] Error 2
which were worrying. In the event of this, I ran make again and it worked. Hmm.]
3. Install NetBeans 8.x. Although I am normally an Eclipse man, NetBeans is frankly better for C/C++ development.
4. Create a new C/C++ application in the hotspot directory.
5. Choose a Java main class to run by right clicking on the project properties and in the "Run" Category. Choose the class to run using the artifact that was built, eg something like:
"${OUTPUT_PATH}" -classpath /home/henryp/Workspaces/workspaceKepler/_MyTests/bin com.phenry.memory.ObjectCreatorMain
6. Insert your breakpoints wherever you wish and press the debug button. Note, if you are remote debugging and your system has been "hardened" for security reasons, you may have some trouble. Follow the instructions here (and the subsequent link) to turn off the security.
A Caveat
Finally, when debugging, you will be using Linux tools. I had problems on an Ubuntu 12.04 system as the tools were not up-to-date (the debugger acts erratically when debugging multi-threaded code). On my Fedora system, everything was fine. The versions I was using were:
[henryp@corsair 9dev]$ gdb -version
GNU gdb (GDB) Fedora (7.4.50.20120120-54.fc17)
.
.
[henryp@corsair 9dev]$ gcc --version
gcc (GCC) 4.7.2 20120921 (Red Hat 4.7.2-2)
.
.
GNU gdb (GDB) Fedora (7.4.50.20120120-54.fc17)
.
.
[henryp@corsair 9dev]$ gcc --version
gcc (GCC) 4.7.2 20120921 (Red Hat 4.7.2-2)
.
.


No comments:
Post a Comment